Data Science · Data Science Core
Exploratory analysis
In Data Science because after the sheet is trustworthy you still have to read it — totals, group-by, and the shape of a column — before you draw a chart or make a claim.
The cleaned shop sheet has eight people. Exploratory analysis is reading that table before you draw a chart: 22 visits and Rs 1760 in the week, then the same numbers split by the plan column the owner named, then whether spend piles up or spreads out. You are not fitting rent. You are asking what the rows are doing.
- Data Science
- Medium level
- 4 concepts
1Summaries of the whole sheet
Before you split anyone, say the week in two numbers you can point at. Add the visits column: 4 + 1 + 6 + 0 + 3 + 2 + 5 + 1 = 22. Add the spent column: 320 + 80 + 510 + 0 + 240 + 150 + 400 + 60 = 1760. Eight customers, 22 visits, Rs 1760 spent. Mean visits are 22 / 8 = 2.75. Mean spend is 1760 / 8 = 220.
Those means are a first sentence, not the whole story. Deepak's 0 and Chitra's 510 are still in the table. A later chart that only quotes 220 has already hidden both of them — which is why the next step splits the same totals by the plan column the owner named.
Figure. Visit counts for the eight people: 4, 1, 6, 0, 3, 2, 5, 1. They add to 22. Mean visits are 22 / 8 = 2.75. Deepak's 0 is in the total.
| stat | value |
|---|---|
| customers | 8 |
| visits (sum) | 22 |
| spent (sum, Rs) | 1760 |
| mean visits | 2.75 |
| mean spent (Rs) | 220 |
| came_back yes | 5 |
Mean visits from the week
Eight customers visited 4, 1, 6, 0, 3, 2, 5 and 1 times. What is the mean visit count?
- 4 + 1 + 6 + 0 + 3 + 2 + 5 + 122
- 22 / 82.75
Pro tip. The mean is one sentence. Deepak's 0 and Chitra's 6 are still in the table.
Coding lab. Sum the week runs in the app, with checks on your output.
Mean spent is Rs 220. What does that number not tell you?
- That Deepak spent 0 and Chitra spent 510 — the spread inside the mean
- That eight people are in the sheet
- That 1760 / 8 is 220
A mean is a ratio of totals. The rows still differ.
2Split by the column the question named
Look at the plan column on the same eight rows. Five people have the word monthly written there: Anu, Chitra, Deepak, Farah, Gopal. Three have drop-in: Bala, Esha, Hari. Now do the same spend total inside each of those two piles. Monthly: 320 + 510 + 0 + 150 + 400 = 1380, and four of those five came back. Drop-in: 80 + 240 + 60 = 380, and one of those three came back.
That split-then-summarise move is what people later call a group-by: do the same summary inside each value of the column the question named. You have not predicted anyone. You have split the sheet the owner asked for. Monthly members spent more this week and came back more often — a story in the rows, not a fitted rent.
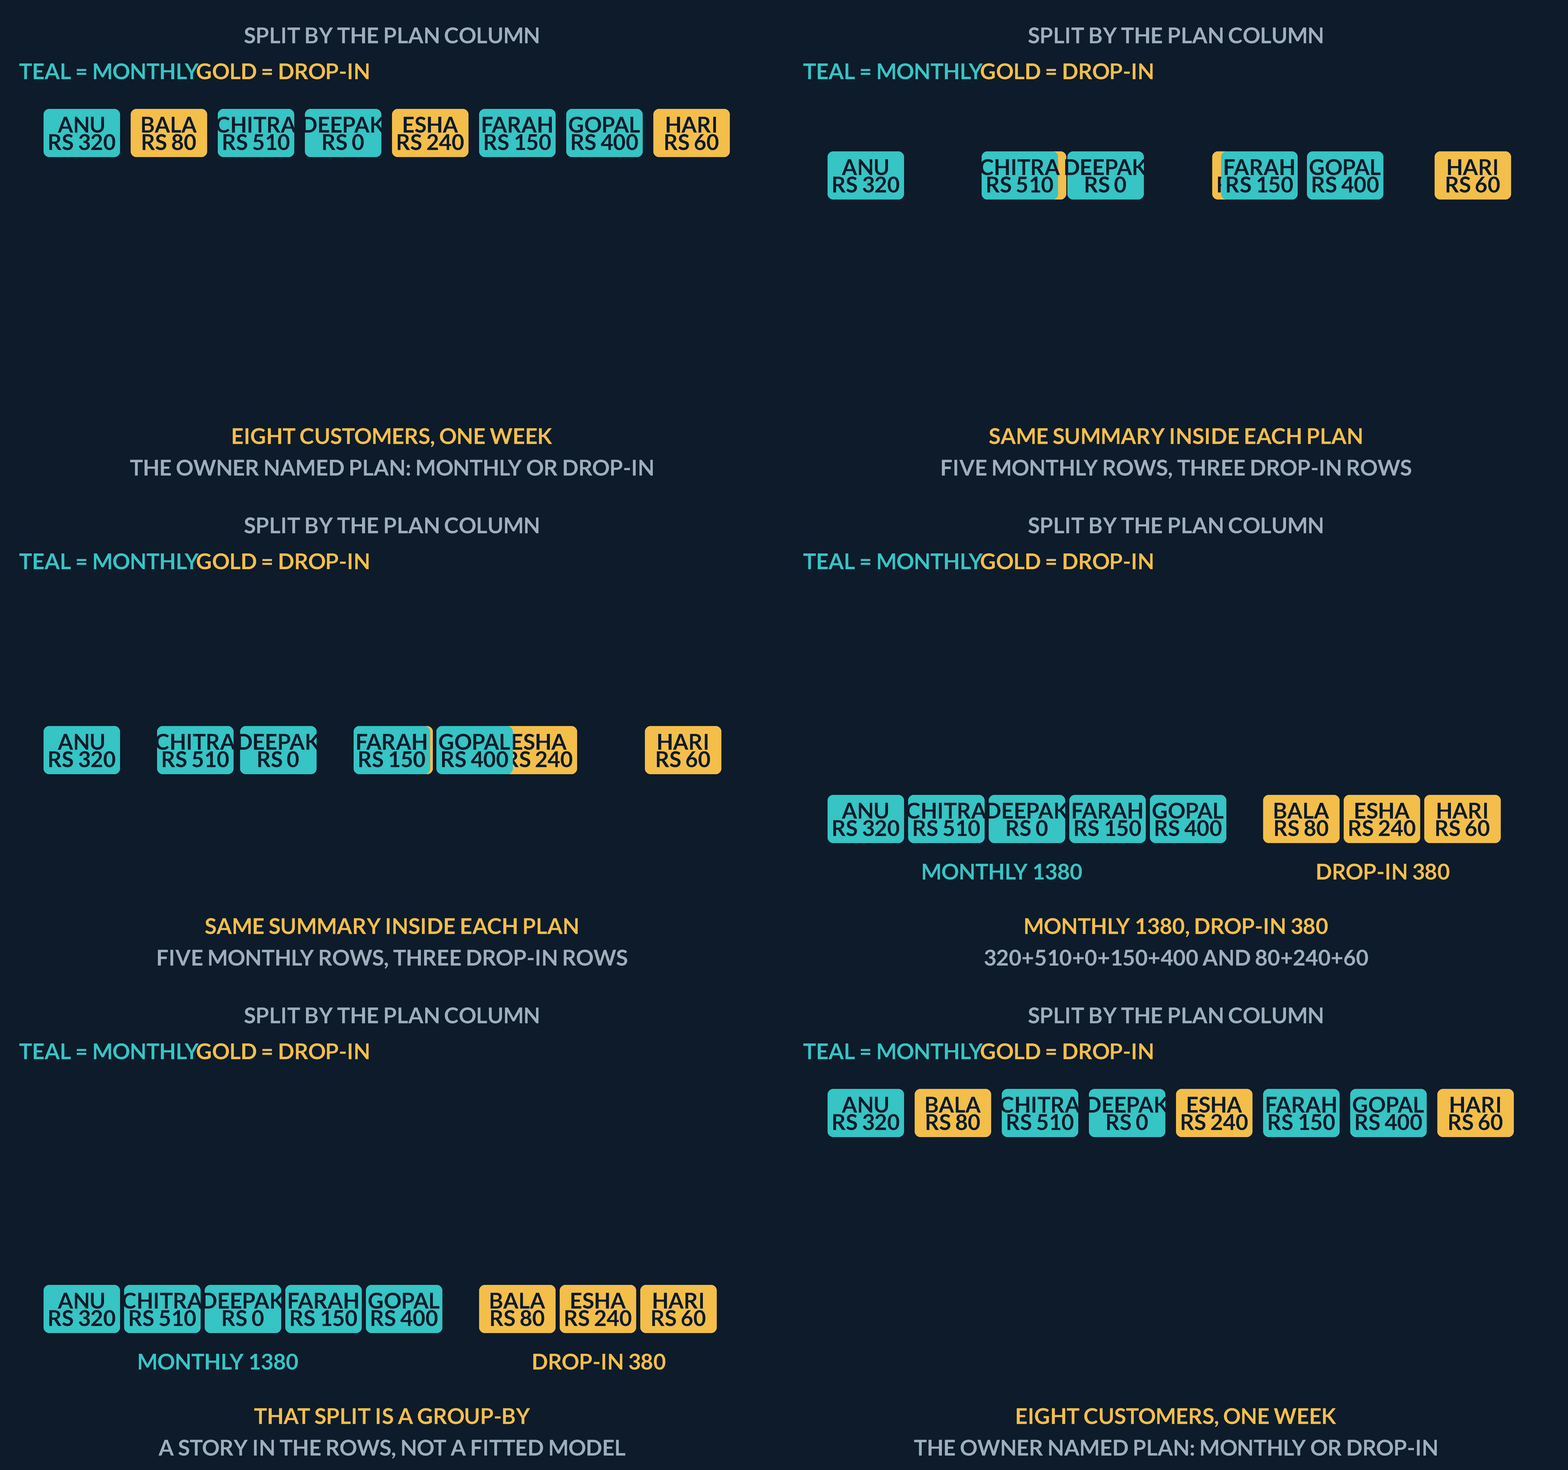
| plan | people | spent (Rs) | came_back yes |
|---|---|---|---|
| monthly | 5 | 1380 | 4 |
| drop-in | 3 | 380 | 1 |
Monthly spend from the five members
Anu 320, Chitra 510, Deepak 0, Farah 150, Gopal 400. What is monthly spend?
- 320 + 510830
- 830 + 0 + 150 + 4001380
Pro tip. Deepak's 0 belongs in the monthly total. Leaving him out would invent a richer group.
Coding lab. Split spend by plan runs in the app, with checks on your output.
Four of five monthly members came back, and one of three drop-ins. What did the plan split do?
- Repeated the comeback count inside each plan
- Fitted a classifier for came_back
- Held out a test fold
The split is the same count inside each plan value, not a model. People later call that a group-by.
3A column has a shape
Spend is not a blob around the mean Rs 220. Line the eight tickets up: Deepak 0, Hari 60, Bala 80, Farah 150, Esha 240, Anu 320, Gopal 400, Chitra 510. Three people sit at Rs 100 or less. Two sit between 101 and 300. Three sit between 301 and 510. The mean is pulled up by Gopal and Chitra, the two busiest monthly members.
A distribution is that pile: how many rows land in each band. If you only quote 220, you miss that most of those three small tickets are far below the mean. The mean is a ratio of totals. The rows still differ.
Figure. Three people spent Rs 0 to 100, two spent 101 to 300, three spent 301 to 510. The mean Rs 220 sits in the middle band; it is not where most of the tickets are.
| band | people | names |
|---|---|---|
| 0 to 100 | 3 | Deepak, Hari, Bala |
| 101 to 300 | 2 | Farah, Esha |
| 301 to 510 | 3 | Anu, Gopal, Chitra |
Band counts add to the sheet
Three people in 0 to 100, two in 101 to 300, three in 301 to 510. Do the bands cover all eight customers?
- 3 + 25
- 5 + 38
Pro tip. If the bands added to 7, someone was missing. If they added to 9, someone was counted twice.
Coding lab. Count spend bands runs in the app, with checks on your output.
Mean spend is Rs 220. Three people spent Rs 100 or less. What is the trap?
- Treating 220 as a typical ticket — most of those three are far below it
- Forgetting that 1760 / 8 is 220
- Thinking Deepak is a duplicate
The mean is pulled by Chitra and Gopal. The pile is not a spike at 220.
4Lab: group the shop by plan
Build the clean eight-row frame again, then ask pandas to do the plan split you just did by hand. groupby('plan') means: cut the sheet into the piles that share the same plan value — monthly and drop-in — and then, inside each pile, add spent. The printed series should show 1380 beside monthly and 380 beside drop-in.
Those are the same two totals you added from the names. The check looks for 1380 so you know the split landed on the column the owner named. You have not trained a regressor and you have not held out a test fold. You have read the sheet the question asked for.
No diagram — the two plan totals are printed by the coding lab.
| Step | Why |
|---|---|
| Build the clean eight-row frame | Same people as the shop sheet |
| groupby('plan')['spent'].sum() | The owner named plan; add spent inside each pile |
| Look for 1380 | Monthly spend — the larger pile |
Coding lab. Sum spend by plan runs in the app, with checks on your output.
groupby('plan')['spent'].sum() printed 1380 and 380. What did you just do?
- Answered the question by splitting the same total
- Trained a regressor for spent
- Held out two rows as a test set
Group-by is exploratory reading, not a fit.
Notes
- In Data Science because after the sheet is trustworthy you still have to read it — totals, group-by, and the shape of a column — before you draw a chart or make a claim.
- Before you split anyone, say the week in two numbers: 22 visits and Rs 1760 spent across 8 customers. Mean visits are 22 / 8 = 2.75. Mean spend is 1760 / 8 = 220.
- Look at the plan column first. Five people have monthly; three have drop-in. Doing the same spend total inside each of those two piles is the split the owner's question asked for.
Exam traps & shortcuts
- Name the question before you open the sheet — a table without a question is just a dump.
- A number is a claim only when you can point at the rows that produced it.
Recap
Summarise the whole sheet, then split by the column the question named, then look at the shape.
- Summaries of the whole sheet
- 22 visits and Rs 1760 across 8 customers. Mean visits 2.75, mean spend Rs 220. Those means still hide Deepak's zero and Chitra's 510.
- Split by the column the question named
- Five monthly members spent Rs 1380 and four came back. Three drop-ins spent Rs 380 and one came back. That split is what people later call a group-by.
- A column has a shape
- Three people spent Rs 0 to 100, two spent 101 to 300, three spent 301 to 510. The mean Rs 220 is not a typical ticket.
- Lab: group the shop by plan
- Print spent summed inside each plan. The check looks for 1380 — monthly spend — so the split landed on the question.
Practise Exploratory analysis
Reading is free and needs no account. Practice, mocks and progress live in the app.
- A 3-question practice set that ends the chapter
- 4 quick checks with worked explanations
- Timed mocks scored with the real marking scheme
- Readiness tracked per topic, kept on your device