Statistical Inference · Statistical Inference
Confidence intervals
In Statistical Inference because an interval is a range for the unknown typical-week number, not a claim that the truth jumped.
Week 1's mean spent is Rs 220, and that mean wobbles by about Rs 63 from week to week — the standard error from the last lesson. A confidence interval turns that wobble into a range for the typical-week mean, the parameter that is not on the sheet. The typical-week number does not jump. The range does.
- Statistical Inference
- Medium level
- 5 concepts
1A range for the typical week
We do not know the typical-week mean spent. We know this week's 220 and we know that week-means wobble by about 63. A useful sentence is then a range: the typical-week mean is somewhere near 220, with a width set by that wobble.
The range is about the parameter, not about Anu. Anu already spent Rs 320. We are not putting a bar around her, and we are not saying every customer spends between two numbers. We are putting a bar around the unknown typical week.
Figure. The interval is Rs 93 to Rs 347 for the unknown typical-week mean, centred on this week's 220.
What the bar is for
- StatisticThis week's mean, Rs 220.
- WobbleWeek-means move by about Rs 63.
- RangeA low-to-high interval for the typical week.
Coding lab. Name the centre runs in the app, with checks on your output.
What does a confidence interval provide that a single point estimate cannot?
- A plausible range of values for the unknown population parameter accompanied by a measure of uncertainty
- A guarantee that 100% of individual population members fall within the band
- An exact prediction of the next individual customer transaction amount
- A proof that the null hypothesis is mathematically impossible
A confidence interval provides a range of plausible values for the parameter that reflects the sampling uncertainty.
2Mean plus or minus two SEs
A simple interval takes the sample mean and walks about two standard errors either side. Two is a teaching stand-in for the usual 95 percent width — textbooks sometimes use 1.96, or a slightly larger t-number when n is 8. The idea is the walk, not the third decimal.
SE is about 63.4. Two SEs are about 2 × 63.4 = 126.8, call it 127. Then 220 − 127 is about 93, and 220 + 127 is about 347. The interval is roughly Rs 93 to Rs 347. That is wide. With eight people it should be.
Figure. SE is 63.4. Two SEs are 2 × 63.4 = 126.8, call it 127. Then 220 − 127 is about 93 and 220 + 127 is about 347. The walk is mean plus or minus two standard errors — the interval is roughly Rs 93 to Rs 347.
Walk two standard errors
Using SE = 63.4, build the two-SE interval around 220.
- 2 × 63.4126.8
- 220 − 126.893.2
- 220 + 126.8346.8
Pro tip. Round to rupees and you get about 93 to 347. Wide is the honest lesson of n = 8.
Coding lab. Build the interval runs in the app, with checks on your output.
With sample mean 220 and standard error 63, what is an approximate 95% confidence interval (mean +/- 2*SE)?
- Rs 157 to Rs 283, obtained by computing 220 +/- 63
- Rs 0 to Rs 440, obtained by doubling the sample mean
- Rs 200 to Rs 240, obtained by arbitrary rounding
- Rs 94 to Rs 346, obtained by computing 220 +/- 126
220 - 2(63) = 220 - 126 = 94 and 220 + 2(63) = 346.
3The typical week stays put
Picture many weeks, each drawing its own interval around its own mean. Week 1 draws a bar around 220. Week 2 would draw a bar around 225. The typical-week value is one fixed line — it does not hop to follow the bar.
Most bars cover that line. A wild week misses it. The line did not jump into the bar. The bar was drawn to catch a fixed number. When a bar misses, the method had an unlucky sample — the typical week did not teleport.
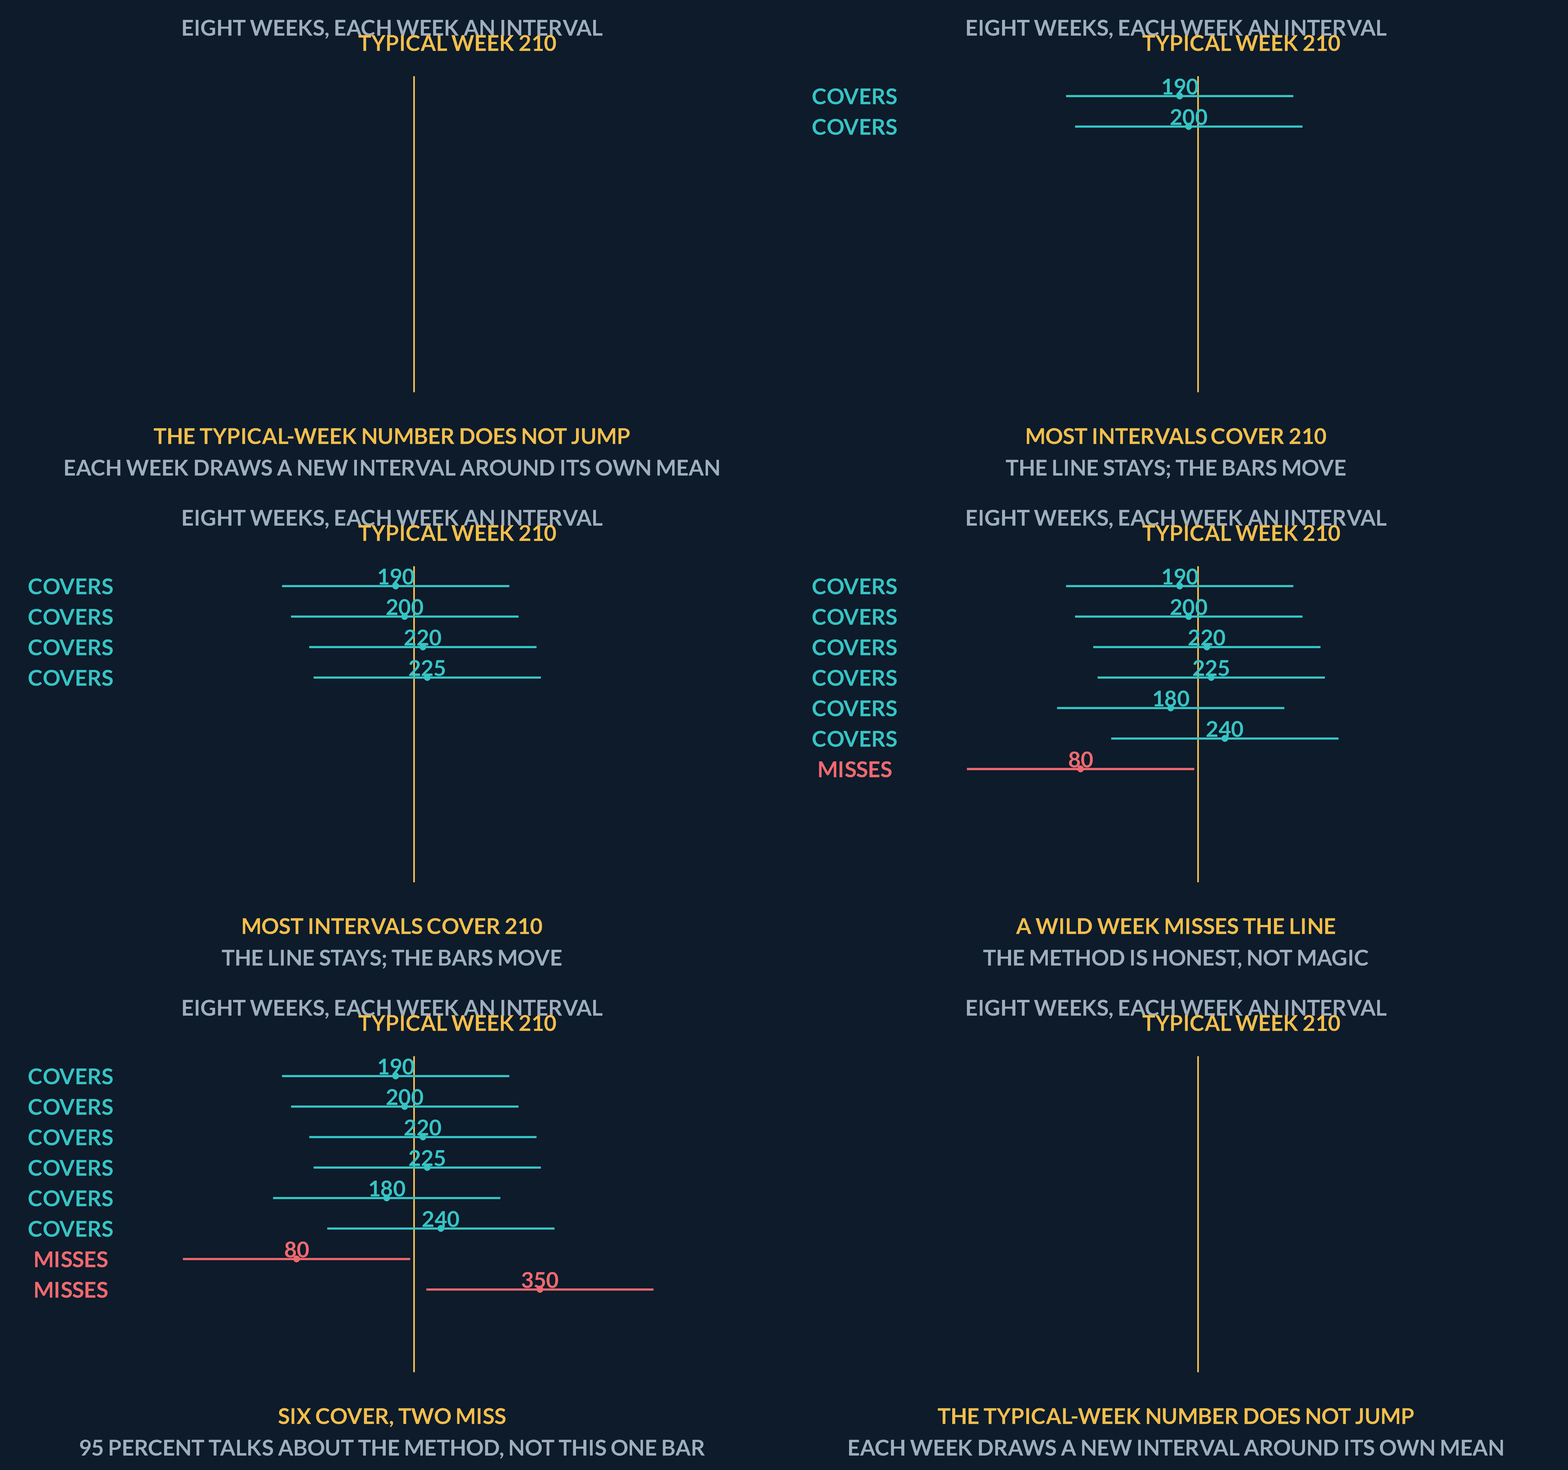
| Thing | Moves? |
|---|---|
| Typical-week mean | No — fixed line |
| This week's interval | Yes — new bar each week |
Coding lab. Does 210 sit inside? runs in the app, with checks on your output.
In frequentist confidence intervals, which quantity is considered fixed and which is random?
- The interval boundaries are fixed while the population parameter moves randomly
- Both the parameter and the interval boundaries are fixed constants
- Both the parameter and the interval boundaries vary with every customer visit
- The population parameter is fixed, while the constructed interval boundaries vary from sample to sample
The parameter mu is an unmoving property of nature. The interval endpoints are random variables that shift with each sample draw.
495 percent is about the method
After you have drawn this week's interval, Rs 93 to Rs 347, the typical-week mean is either inside it or not. There is no leftover probability that the truth is 'jumping'. The randomness was in which eight people walked in — Anu through Hari, not a moving shop.
Saying we are 95 percent confident means: if we repeated the whole method on many weeks, about 95 percent of those bars would cover the fixed number. It does not mean this bar has a 95 percent chance of containing a moving truth.
No diagram — the idea is carried by the prose, table, code block or coding lab.
| Reading | Honest? |
|---|---|
| The method covers on about 95 percent of weeks | Yes |
| This bar has a 95 percent chance the truth jumped in | No |
Week 1's interval is about 93 to 347. Which sentence is honest?
- The typical-week mean is either in that range or not; 95 percent describes the method
- There is a 95 percent chance the typical-week mean is currently jumping between 93 and 347
- Anu spent somewhere between 93 and 347
The parameter is fixed. The method is what has a long-run hit rate.
5A wide interval is the lesson
Rs 93 to Rs 347 is an almost useless business range. The owner cannot price a weekly order from a band that wide. That is not a bug in the arithmetic. Eight noisy spenders — Deepak at 0, Chitra at 510 — cannot pin a typical week to the nearest ten rupees.
Shrinking the bar by pretending SE is tiny would be the bug. If the owner wants a tighter interval, the honest move is more customers, not a braver sentence. Width is the lesson the eight-row sheet is allowed to teach.
Figure. The two-SE interval around 220 runs from about 93 to 347. Full width is 2 × 126.8 = 253.6, about Rs 254. Eight noisy spenders — Deepak at 0, Chitra at 510 — cannot pin a typical week to the nearest ten rupees. Shrinking the bar by pretending SE is tiny would be the bug.
Width of the week-1 interval
How wide is the two-SE interval around 220?
- 2 × 63.4126.8
- 2 × 126.8253.6
Pro tip. The full width is about Rs 254. n = 8 bought you a wide, honest bar.
Coding lab. Print the width runs in the app, with checks on your output.
If an interval for weekly mean customer spend comes out as [Rs 93, Rs 347], what is the honest takeaway?
- The statistical formulas are invalid and should be discarded
- The shop owner is guaranteed to earn exactly Rs 220 every week
- The sample is too small to pin down the mean with high precision, accurately communicating high uncertainty
- Every individual customer spent between Rs 93 and Rs 347
A wide confidence interval faithfully reflects substantial sampling uncertainty due to small sample size.
Notes
- In Statistical Inference because an interval is a range for the unknown typical-week number, not a claim that the truth jumped.
- We do not know the typical-week mean spent. We know this week's 220 and we know that week-means wobble by about 63. A useful sentence is then a range: the typical-week mean is somewhere near 220, with a width set by that wobble.
- A simple interval takes the sample mean and walks about two standard errors either side. Two is a teaching stand-in for the usual 95 percent width — textbooks sometimes use 1.96, or a slightly larger t-number when n is 8. The idea is the walk, not the third decimal.
Exam traps & shortcuts
- A sample number describes these rows. A population claim reaches past them.
- Fail-to-reject is not proof. A p-value is not the chance the null is true.
Recap
Build a range from the sample mean and about two standard errors. The population value stays put. '95 percent' talks about the method, not this one bar.
- A range for the typical week
- We do not know the typical-week mean spent. We know this week's 220 and we know that week-means wobble by about 63. A useful sentence is then a range: the typical-week mean is somewhere near 220, with a width set by that wobble.
- Mean plus or minus two SEs
- A simple interval takes the sample mean and walks about two standard errors either side. Two is a teaching stand-in for the usual 95 percent width — textbooks sometimes use 1.96, or a slightly larger t-number when n is 8. The idea is the walk, not the third decimal.
- The typical week stays put
- Picture many weeks, each drawing its own interval around its own mean. Week 1 draws a bar around 220. Week 2 would draw a bar around 225. The typical-week value is one fixed line — it does not hop to follow the bar.
- 95 percent is about the method
- After you have drawn this week's interval, Rs 93 to Rs 347, the typical-week mean is either inside it or not. There is no leftover probability that the truth is 'jumping'. The randomness was in which eight people walked in — Anu through Hari, not a moving shop.
Practise Confidence intervals
Reading is free and needs no account. Practice, mocks and progress live in the app.
- A 2-question practice set that ends the chapter
- 5 quick checks with worked explanations
- Timed mocks scored with the real marking scheme
- Readiness tracked per topic, kept on your device