Retail Investing · Equity & Fundamental Analysis
Operating Cash, Free Cash, and the Growth Loop
What +ve vs −ve OCF means, when a minus is a growth factory vs a leak, and how cash, capex, and working capital feed next year's sales.
Five concepts. Helio Year 1 produced +17 of operating cash and spent 10 on a plant. Year 2 produced −14 of operating cash while sales grew to 130. Cedar Tools Ltd, a second teaching company, prints minus OCF in both years while sales fall — the leak case next to Helio's factory. This lesson is the causal chain: cash, reinvestment, next year's sales — and when a minus is a factory versus a leak. Idle cash, left in the bank, buys no extra sales.
- Retail Investing
- Medium level
- 5 concepts
1What +ve and −ve OCF mean
Positive operating cash flow means the core business collected more cash than it spent on operations in the period. Helio Year 1 OCF is +17: operations added 17 to the cash tank before capex. Opening cash 20 plus 17 is 37 sitting there before the plant is paid for.
Negative OCF means operations consumed cash. Helio Year 2 OCF is −14: the business needed 14 of cash just to run, before any new plant. A minus is a fact about cash this year. It is not, by itself, a verdict that the business is broken.
Figure. Year 1 operations added 17 of cash. Year 2 operations consumed 14. The heights are the cash moved — the story of why sits in the next concept.
How it works
- PlusOperations filled the tank — Helio Year 1, +17.
- MinusOperations drained the tank — Helio Year 2, −14.
- Do not stopAsk where the cash went: plant and stock, or customers who never paid.
Cedar Tools: two years of minus OCF, a leak
Cedar Tools Ltd (teaching company, not a tip). Year 1 (Rs crore): PAT 12, depreciation 4, receivables +14, inventory +7, payables +1; sales 60. Year 2: PAT 6, depreciation 4, receivables +11, inventory +4, payables 0; sales 58. Compute each year's OCF, then the sales change.
- Year 1 12 + 416
- 16 - 14 - 7 + 1-4 Year 1 OCF
- Year 2 6 + 410
- 10 - 11 - 4 + 0-5 Year 2 OCF
- Sales 58 - 60-2
Pro tip. Both years print minus OCF, and sales fell while receivables kept rising. The cash did not become next year's sales — a leak, not a factory.
2A minus can be a factory or a leak
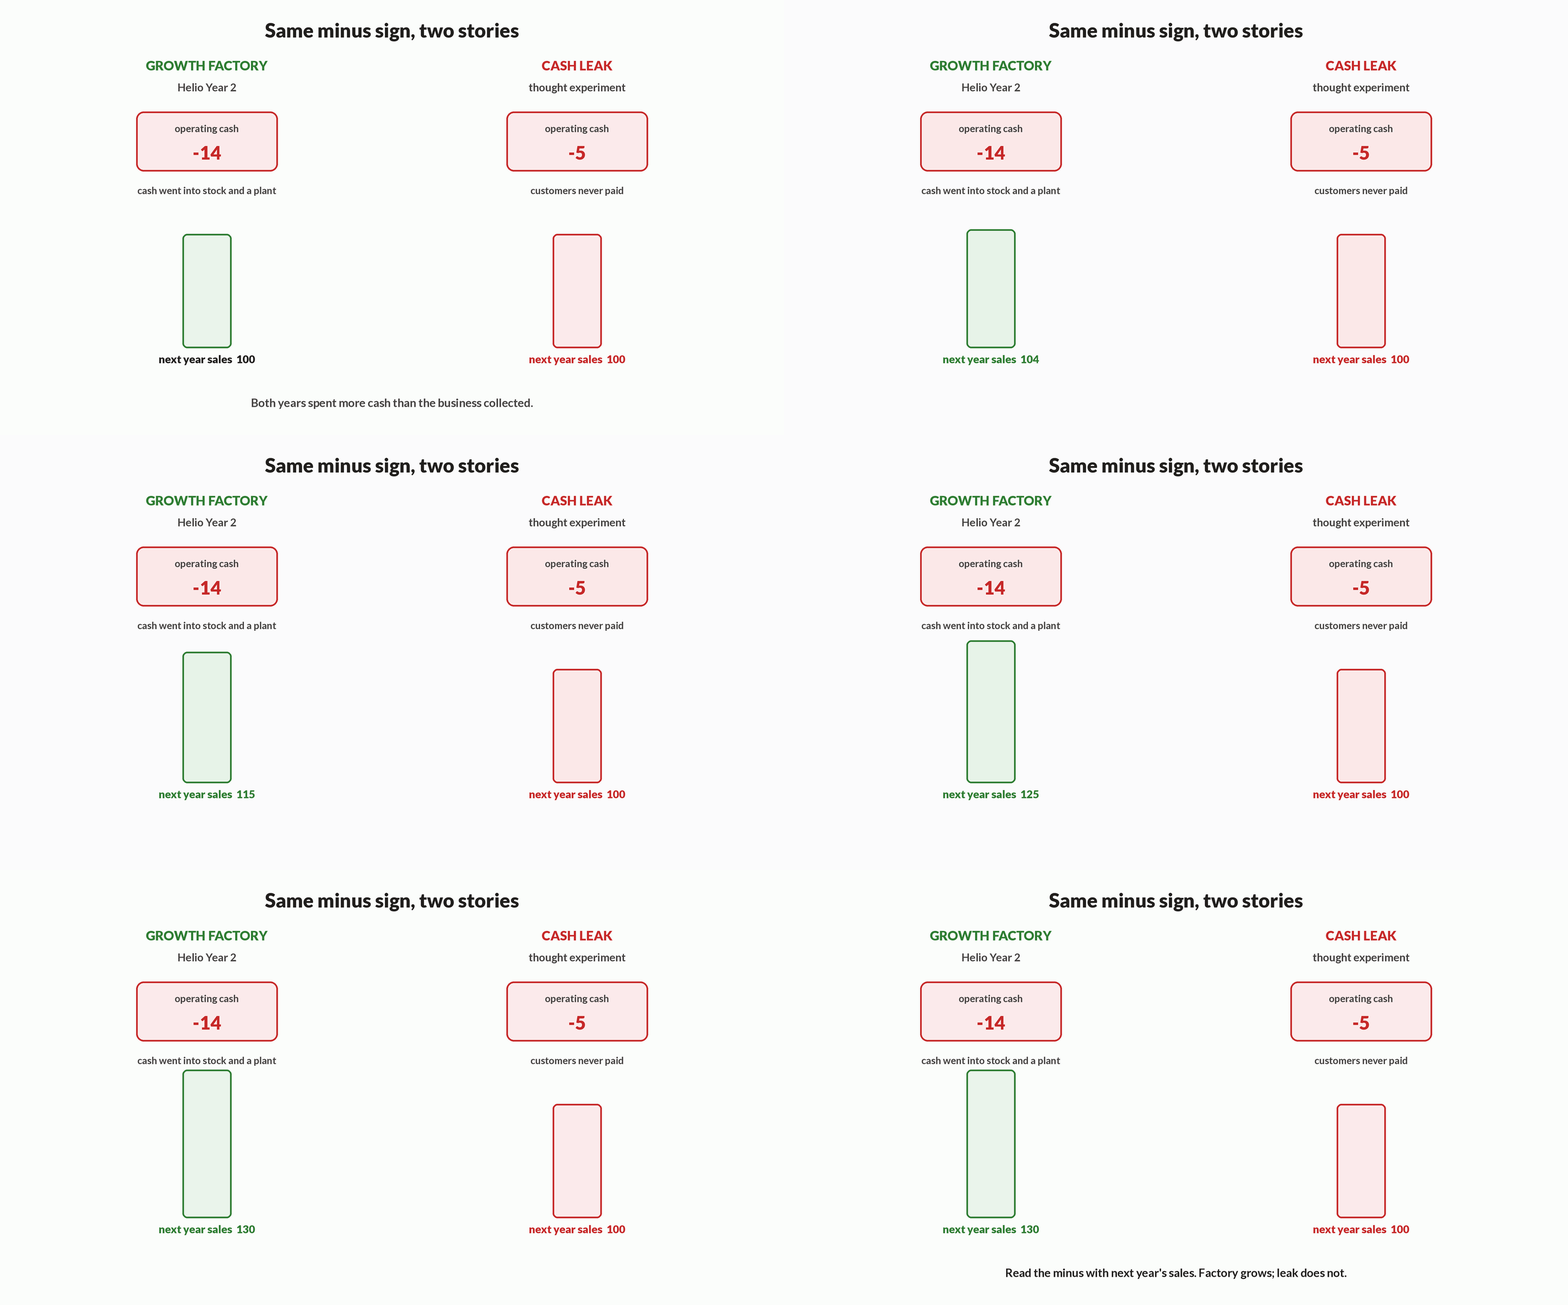
Helio Year 2 spent cash because receivables jumped 18 → 48 (plus 30) and inventory 14 → 32 (plus 18) while it also ran a larger book of sales. PAT was 22 and depreciation 9, but working capital swallowed them: 22 + 9 − 30 − 18 + 3 = −14. Next year's sales are 130, up from 100 — the cash went into stock and customers of a bigger book. That minus is a growth factory.
A leak looks similar on one line and fails the next-year test. Imagine PAT still 16 but receivables 12 → 40 because customers never paid, and sales the next year stay 100. OCF is 16 + 8 − 28 − 4 + 3 = −5, and nothing extra was built. Same minus sign, no extra sales. Read the minus with next year's sales and with whether the missing cash is still an asset you can collect.
How it works
- Name the minusHelio Year 2 OCF −14; leak thought-experiment OCF −5.
- Ask where it wentPlant and collectible stock, or invoices that never turn into cash.
- Check next salesFactory: 100 → 130. Leak: 100 → 100.
Helio Year 2: minus OCF as a growth factory
Helio Sensors Year 2 statements (Rs crore): PAT 22, depreciation 9, receivables +30, inventory +18, payables +3. Year 1 sales were 100 and OCF was +17; Year 2 sales are 130. Compute Year 2 OCF, then the sales change.
- 22 + 931
- 31 - 301
- 1 - 18-17
- -17 + 3-14 OCF
- Sales 130 - 100+30 (30 percent)
Pro tip. OCF flipped from +17 to −14 while sales rose 30 percent and the missing cash is still in invoices and stock — a factory, not a leak.
3Free cash, capex, and working capital are the joints
Working capital is already inside OCF: Helio's receivables, inventory, and payables moves were the adjustments in the PAT-to-OCF walk. Capex is not. Capex is cash spent on plant and equipment, reported as investing. Helio Year 1 capex is 10.
Free cash flow to the firm, in the simple retail walk, is OCF minus capex. Year 1: 17 − 10 = 7. That 7 is what is left after keeping the operations funded and after paying for the plant. Year 2: −14 − 16 = −30. The joints are OCF (operations plus working capital) then capex then FCF. Miss a joint and the flow from PAT to next year's sales has a hole.
Figure. Year 1 operations produced 17. The plant took 10. Seven of free cash remains — the joint between this year's operations and what is left for debt, dividends, or a larger cash balance.
How it works
- OCF already has WCDo not subtract receivables again after OCF.
- Subtract capexYear 1: 17 − 10 = 7 FCF. Year 2: −14 − 16 = −30 FCF.
- FCF can be negativeGrowth years often are. Then cash on the balance sheet falls, or debt rises.
| Joint | Year 1 | Year 2 |
|---|---|---|
| OCF | +17 | −14 |
| Capex | 10 | 16 |
| FCF (OCF − capex) | +7 | −30 |
| New debt | 0 | 24 |
| Closing cash | 27 | 21 |
Year 1 cash rollforward
Opening cash 20, OCF +17, capex 10, no new debt. Confirm closing cash and FCF.
- FCF 17 - 107
- Closing cash 20 + 727
- Same as 20 + 17 - 1027
Pro tip. FCF is the change in cash when financing is zero. Year 2 needs the debt joint as well.
4Cash induces growth only if it is put to work
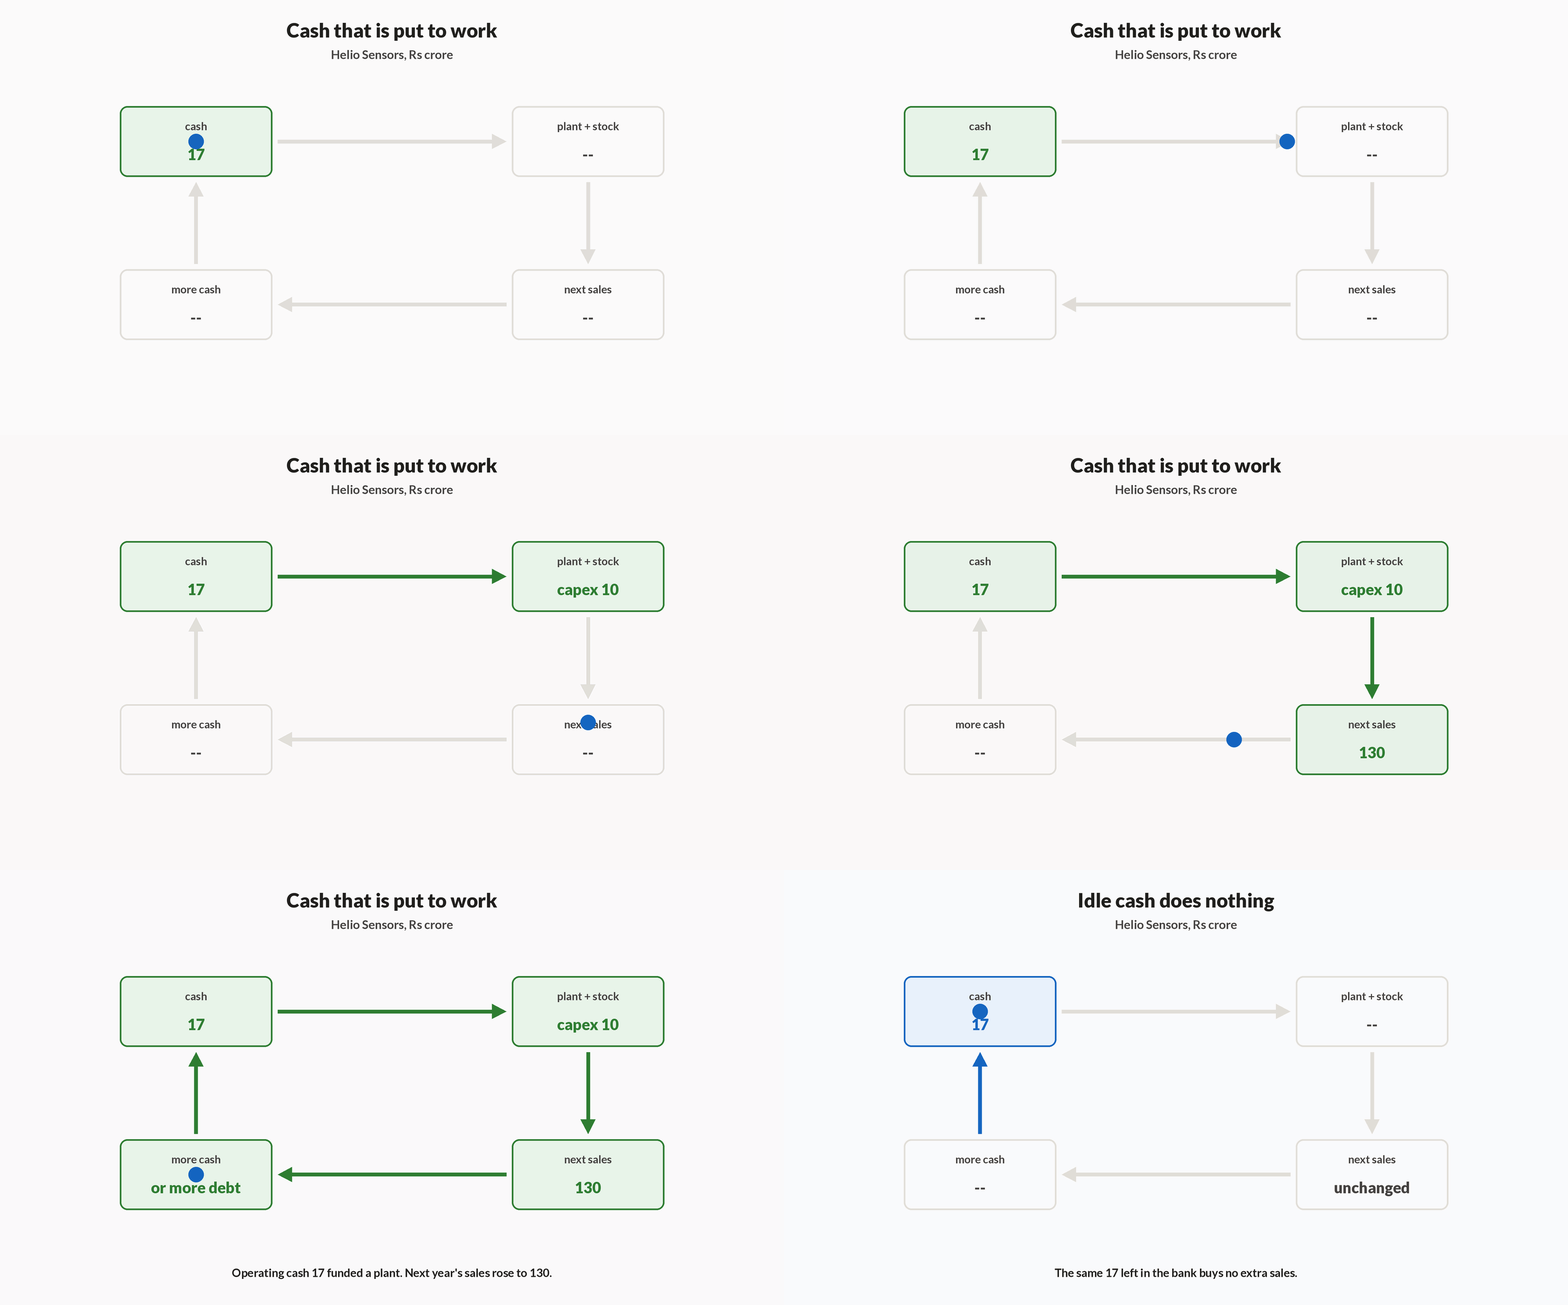
Positive OCF does not automatically become more sales. Helio put Year 1's operating cash to work: capex 10 plus extra stock and receivables. The plant and the extra working capital are why Year 2 sales can be 130 rather than another 100. Cash → reinvestment → capacity and stock → revenue → more cash, or more debt if FCF is negative.
The same 17 left idle in the bank buys no extra plant and no extra stock. Next year's sales then stay near 100. Idle cash is safe in a narrow sense and useless as a growth engine. Growth needs the cash to leave the cash line and become productive assets — and those assets need to earn.
How it works
- Put to workOCF funds capex and working capital.
- Next salesHelio: 100 → 130 after Year 1 reinvestment.
- Or sitThe same 17 in the bank leaves sales unchanged.
Idle versus invested Year 1 cash
Helio has OCF 17. Path A spends capex 10. Path B spends capex 0 and parks the cash. What is Year 1 closing cash in each path, and which path can raise Year 2 sales?
- Path A closing cash 20 + 17 - 1027, plant up 10
- Path B closing cash 20 + 1737, plant unchanged
- Year 2 salesA can rise; B stays near 100
Pro tip. Closing cash is higher in B. That is not the same as a better business.
5One flow, two years
Read Helio as one chain, not five separate PDFs. Year 1: sales 100 → EBITDA 30 → PAT 16 → OCF 17 → capex 10 → FCF 7 → cash 20 → 27, equity 80 → 96. That reinvestment is the input to Year 2 sales of 130.
Year 2: sales 130 → PAT 22 → OCF −14 → capex 16 → FCF −30. Cash would have collapsed without financing; Helio borrowed 24 and cash closed at 21. The loop continued — more sales — by adding debt because free cash was negative. Growth funded by operations is one story; growth funded by new loans is another. Both can be rational. Mix them up and you will misread a minus.
Figure. Year 2 sales are 30 higher after Year 1's reinvestment — and Year 2 also borrowed 24 because free cash was −30. Growth and new debt arrived together.
How it works
- Year +OCFSales 100, PAT 16, OCF 17, FCF 7, cash up to 27.
- Year −OCFSales 130, PAT 22, OCF −14, FCF −30, debt +24, cash 21.
- The linkYear 1's plant and extra WC are why Year 2 sales are 130.
| Step | Year 1 (+OCF) | Year 2 (−OCF) |
|---|---|---|
| Sales | 100 | 130 |
| PAT | 16 | 22 |
| OCF | +17 | −14 |
| Capex | 10 | 16 |
| FCF | +7 | −30 |
| Debt change | 0 | +24 |
| Closing cash | 27 | 21 |
Year 2 cash with the debt joint
Opening cash 27, OCF −14, capex 16, new debt 24. Confirm closing cash.
- Operations and capex27 - 14 - 16 = -3
- Add new debt-3 + 24 = 21
- FCF was -30; debt filled 24 of itcash still fell by 6
Pro tip. Negative FCF is either a smaller cash balance or a larger claim by lenders — here, both.
Notes
- Positive OCF filled Helio's tank by 17 in Year 1; negative OCF drained 14 in Year 2.
- A minus is a factory when the cash became plant, stock, or collectible invoices and next year's sales rise; a leak when they do not.
- FCF ≈ OCF − capex. Working capital is already inside OCF.
- Idle cash does not induce sales. Reinvested cash can — and may still need new debt if FCF is negative.
Formulas
- FCF ≈ OCF − capex
- Closing cash ≈ opening cash + OCF − capex + net new debt
Exam traps & shortcuts
- Always pair a minus OCF with next year's sales and with whether the missing cash is still an asset.
- Do not subtract working capital twice: it is already in OCF.
Reference tables
Same company as PAT vs Cash. Year 1 is the +OCF reinvestment year; Year 2 is the −OCF growth year that also borrowed.
| Step | Year 1 | Year 2 |
|---|---|---|
| Sales | 100 | 130 |
| PAT | 16 | 22 |
| OCF | +17 | −14 |
| Capex | 10 | 16 |
| FCF | +7 | −30 |
| New debt | 0 | 24 |
| Closing cash | 27 | 21 |
Recap
Keep the joints.
- +OCF
- Operations filled the tank — Helio Year 1, +17
- −OCF
- Factory or leak — read next year's sales
- FCF
- OCF minus capex; WC already sits in OCF
- Loop
- Cash → plant/stock → sales → cash or debt
- Idle
- Cash that never leaves the bank buys no extra sales
Practise Operating Cash, Free Cash, and the Growth Loop
Reading is free and needs no account. Practice, mocks and progress live in the app.
- Timed mocks scored with the real marking scheme
- Readiness tracked per topic, kept on your device